Home → TutorialsOverview
A Short Overview of Sketchify
Zeljko Obrenovic, TU/e Eindhoven
Last updated: 27/08/2009
Table of Content
- Introduction
- Defining Interaction through Transitions among Sketches
- Presenting Variables through Active Regions
- Updating Variables based on User-Triggered Events
- Sketching as a Visual Coordination Language
- Examples to Import in Sketchify
- To Probe Further
Introduction
With our support for freehand sketching, we wanted to exploit the freedom and expressiveness of pen-based gesturing. Our freehand sketching environment serves two functions. First, it facilitates the creation of the graphical elements that are part of an interactive solution. Second, it plays a key role in defining the dynamics of the interaction through sketch transitions, the capturing of user events, and graphical transformations.
From a designer’s point of view, the environment looks very similar to a simple image editor (see Video 1), with some additions for working with variables and with support for specialized tools, such as timers, which are useful when controlling the dynamic behavior of the interaction. Our environment supports standard options for free-hand drawing, including setting stroke parameters, such as width and color. Our platform offers a limited number of colors and image manipulation options as this was considered sufficient in the conceptual stage of design. However, with a single mouse click, a user can open a sketch that has been created in a more advanced image manipulation program, such as Gimp, Paint.NET or Adobe Photoshop. Next to the main drawing layer, we also provide an annotation layer, where designers can draw on top of the main sketch, without affecting it. This latter feature is expected to be especially useful when discussing a sketch with other designers or end users.
Video 1. Images in AMICO Sketchify - drawing, import, clipboard.
Designers can create freehand sketches that consist of two types of elements: inactive elements (also called background images) and active regions. A background image is created by means of pen strokes or can be imported from an image file. An active region is a rectangular part of the sketch that can contain drawings, text or images. Active regions can capture mouse (or pen) events and can update variables in response to such events. They can also be graphically transformed (translated, rotated, skewed) in response to updates of variables.
Defining Interaction through Transitions among Sketches
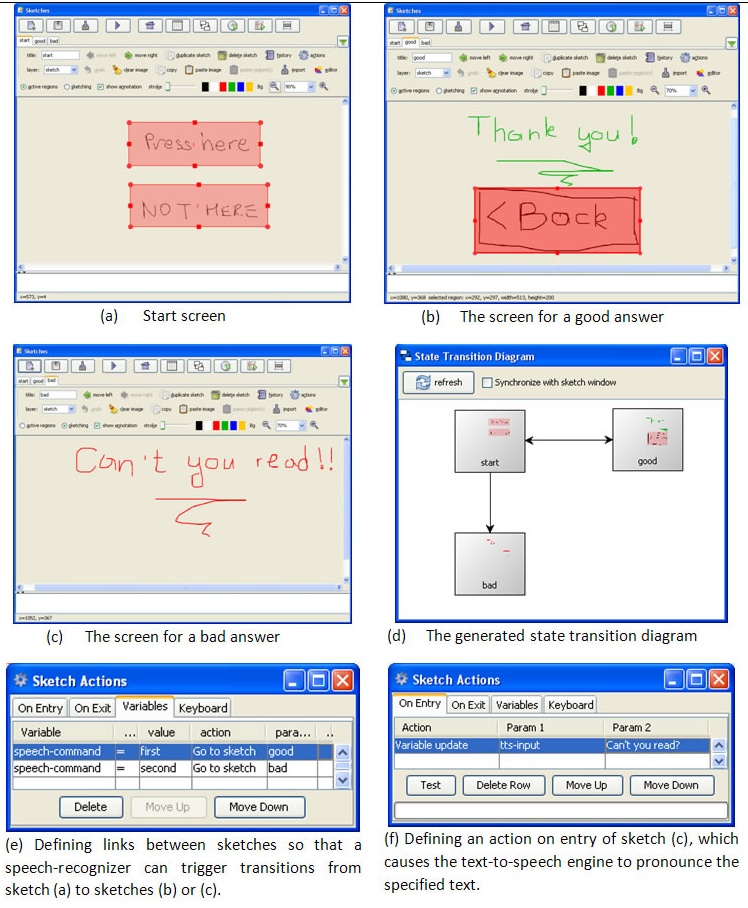
One way of defining interaction within AMICO Sketchpad is by creating transitions among sketches. Linking sketches and defining conditions for transitions between them is one of a key functionality of our system. In its simplest form, our tool can define transitions in the same way as screen prototyping tools do, i.e., in response to mouse clicks and keyboard presses. Figure 1 (a, b, and c) illustrates this by means of a simple example that consists of three sketches, each representing one screen of the interface. The start screen (a) has two active regions that respond to mouse clicks. When a user clicks on the first active region (top) he will move to the second sketch (b), and when he clicks on the second region, he will move to sketch (c). The second sketch (b) also has one active region, enabling the user to return to the start screen (a). The system automatically generates and displays a state transition diagram, which helps the designer to get an overview of the available sketches and the possible transitions among them (d). State transition diagrams are similar to the storyboards used in electronic sketching systems, but in our approach they are a side result of sketching, i.e., they are created without requiring any explicit action on the part of the designer. See also Video 2.
Figure 1. Simple example that illustrates sketching with state transitions. The start screen (a) has two active regions that capture mouse clicks. When a user clicks on the first active region (top) he will move to the second sketch (b), and when he clicks on the second region, he will move to sketch (c). The second sketch (b) also has one active region, enabling the user to return to the start screen (a). Transitions can also be triggered by variable updates (e), while a transition to a sketch can cause the update of a variable (f).

Video 2. Defining Interaction with State Transitions (see also how to open this example in Sketchify).
Presenting Variables through Active Regions
The support for state transitions, as described in the previous section, only allows the sketching of interaction at a relatively high level, where each interaction state is identified by an individual sketch. Through the combined use of active regions and variables, however, an individual sketch can also become “alive” and animated.
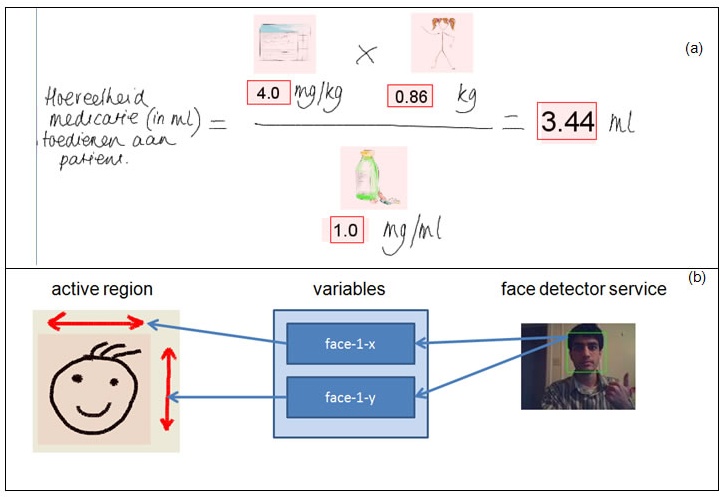
Active regions can be used to dynamically visualize data since we can control many properties of such active regions through variables, including their textual label, the path to the image file that they are associated with, or their geometrical properties such as position, orientation and size. Figure 2a shows how the values of four numerical variables, which are updated in response to calculations that are performed within a spreadsheet, are converted into textual labels for active regions that are part of a freehand sketch. Figure 2b illustrates how the position of a face, as estimated by a face detector, can be mapped to the position of an active region. See also Video 3 and 4.
Figure 2. Presenting variable values within sketches through updating the textual labels of active regions (a) or by translating an active region (b).

Video 3. Using face detector to animate active region position (see also how to open this example in Sketchify).
Video 4. Using active regions to show numeric values. Also illustrates working with spreadsheets (see also how to open this example in Sketchify).
Active regions can be constrained in terms of their maximum and minimum position and orientation. It is also possible to constrain the motion of an active region to a sketched trajectory. When such constraints are imposed, the position of the region can also be specified in relative terms, stating, for example, that the region should be positioned midway along the trajectory. An active region can also detect overlap with other regions and can trigger variable updates accordingly. In this way, dragging one active region on top of another one may for instance trigger the transition to another sketch.
Updating Variables based on User-Triggered Events
Active regions can update variables in response to user actions, i.e., they can react to characteristics of mouse motion (i.e., the distance, speed and direction of movement) and mouse button events. By default, mouse dragging in combination with a left button press is mapped to the translation of an active region, while mouse dragging in combination with a right button press is mapped to the rotation of an active region.
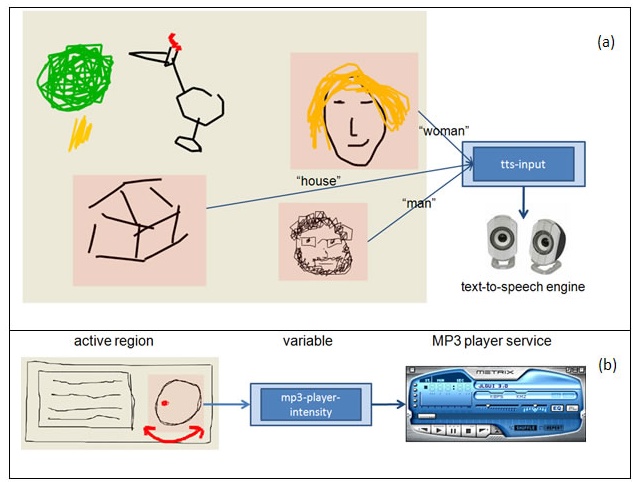
Figure 3a (see also Video 5) iillustrates this functionality by means of a simple interactive sketch of a children’s audio book. On top of a background image, several transparent active regions are defined that capture mouse clicks, updating, in response, a variable “tts-input” with an a priori defined text. Update of this variable causes a text-to-speech engine to pronounce the given text. Figure 3b illustrates another example, where the orientation of an active region is mapped to the volume control of an MP3 player, enabling a user to control the volume by rotating the active region.
Figure 3. Mapping mouse button clicks (a) and mouse movements (b) to variable updates that trigger interactive events.

Video 5. Calling text-to-speech service based on user mouse clicks (see also how to open this example in Sketchify).
Sketching as a Visual Coordination Language
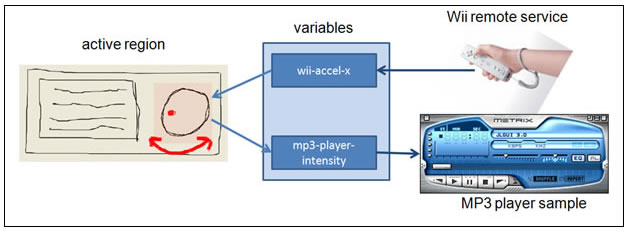
Active regions can be connected to more than one variable, and the update of any of the connected variables will result in an update of all associated variables. Therefore, active regions can be used to connect variables in a simple and intuitive way. Figure 4 shows how this type of mapping can be used as a visual language to connect the motion detected by a Wii accelerator to the volume of an MP3 player.
Figure 4. Using graphical transformations as a visual coordination language: mapping the output of a Wii remote accelerator to the rotation of an active region in the sketch, and subsequently mapping this rotation to the volume control of an MP3 player.

Examples to Import from URL in Sketchify
You can open the examples from this tutorial in Sketchify by using "Import from URL" function (in the File menu), and copy-and-paste there the URL of an example.
- State Transitions Example, URL:
- Face Detector Example, URL:
- Spreadsheets Example, URL:
- Text-to-Speech Example, URL:
